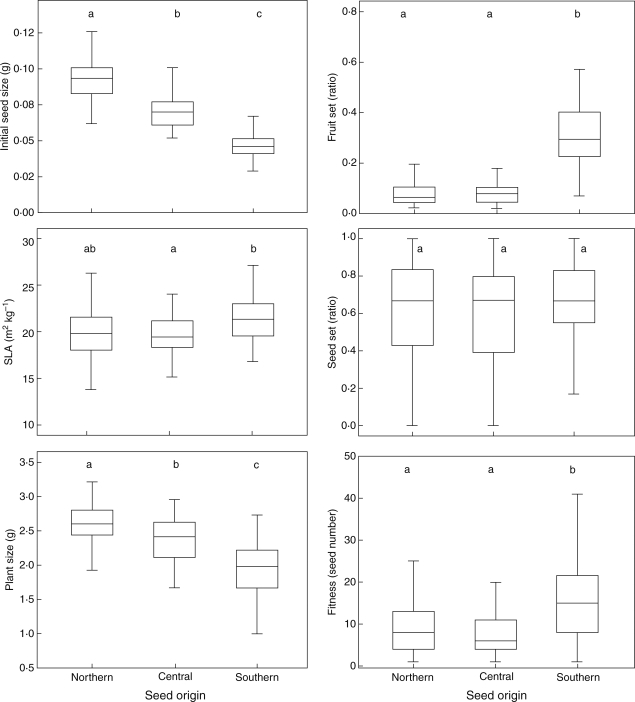
Fig. 3.
Box-and-whiskers plots showing seed origin median, 75th and 25th percentiles, and ranges of several plant traits and fitness. Different letters within a plot indicate significant differences among seed origins at P = 0·05 after Dunnet's T3-corrected multiple comparisons. Plant size is above-ground dry biomass.

