Fig. 1.
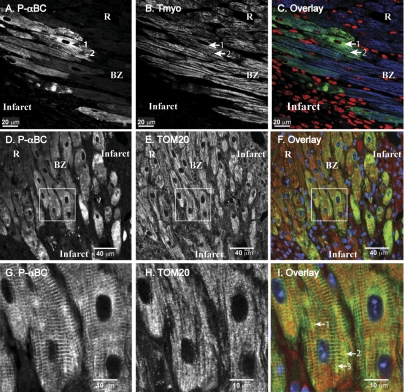
Confocal immunocytofluorescence analysis of phospho-αB-crystallin (αBC)-S59 in mouse hearts after myocardial infarction. FVB mice were subjected to in vivo myocardial infarction via permanent occlusion of the left ascending coronary artery. Four days after the surgery, mice were euthanized and sections were prepared. All procedures have been previously described (18, 47). Micrograph represents results from 3 different mice. A: section of a mouse heart that included the infarct and surviving myocytes in the border zone (BZ) and in a remote region, distant from the infarct (R), was stained for phospho-αBC-S59 (P-αBC). Arrow 1 points to nonsarcomeric phospho-αBC-S59, while arrow 2 points to phospho-αBC-S59 that stained in a sarcomeric pattern. B: section sequential to that shown in A was stained for tropomyosin. Arrows 1 and 2 point to the same regions of the same cells as in A. C: sections shown in A and B were overlayered and the P-αBC, tropomyosin, and nuclei stainings are shown in green, blue, and red, respectively. Arrows 1 and 2 point to same regions of same cells as in A and B. D and G: section of a mouse heart that included the infarct and surviving myocytes in the border zone and in a remote region, distant from the infarct, was stained for phospho-αBC-S59. Box shows region that was scanned at a higher magnification in G. E and H: section sequential to that shown in D was stained for TOM20. Box shows region that was scanned at a higher magnification in H. F and I: sections shown in D and G were overlayered and the P-αBC, tropomyosin, and nuclei stainings are shown in green, red, and blue, respectively. Arrows 1, 2, and 3 point to same regions of same cells as in D and G.

