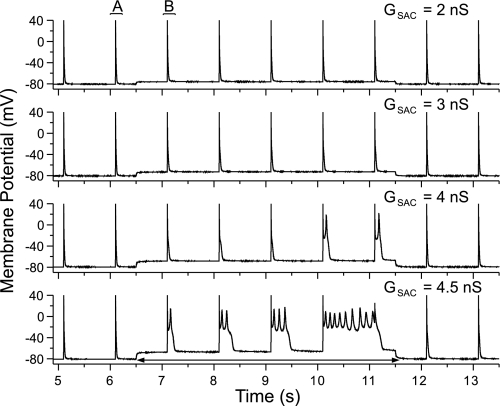
Fig. 2.
Recordings from the same cell in Fig. 1 after 10-min exposure to 100 μM H2O2 with GSAC levels of 2, 3, 4, and 4.5 nS. EADs occurred at GSAC levels of 4 and 4.5 nS with increasing EAD duration during SAC activation. No EAD was produced before or after the GSAC application.

