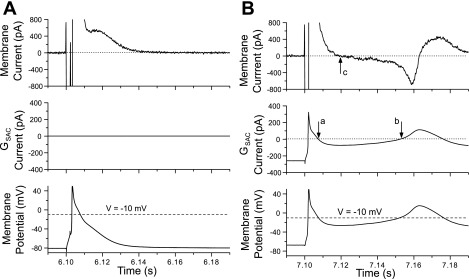
Fig. 3.
Demonstration of the time course of membrane current (top), GSAC current (middle), and membrane potential (V; bottom) for the action potentials (APs) occurred just before (A) and after (B) SAC (4.5 nS) activation. B: points labeled a, b, and c indicate times points when the current changes polarity.

