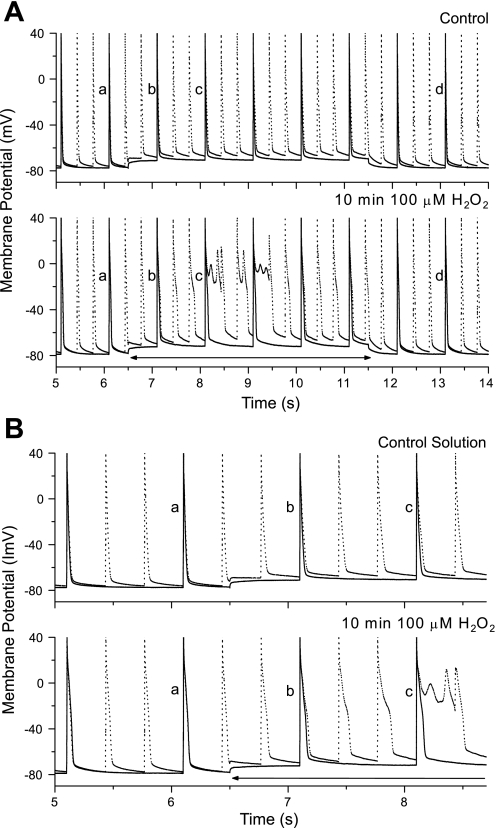
Fig. 5.
A: superimposed recordings from an isolated rat ventricular cell stimulated at 1 Hz (solid lines) and 3 Hz (dotted lines) before (top) and after 10 min exposure to 100 μM H2O2 (bottom), with GSAC (2 nS) activation period indicated by double-headed arrows. EADs occurred in H2O2 solution only at 3-Hz stimulation during this low GSAC application. B: a faster time scale illustrating the changes in APs (replotted from A).

