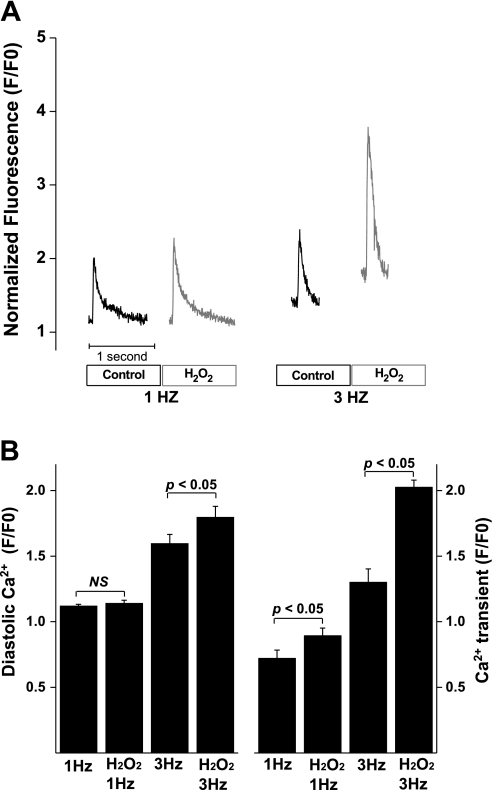
Fig. 7.
H2O2-induced increase in diastolic Ca2+ and Ca2+ transient in rat ventricular myocytes. A: the representative Ca2+ transient traces in response to the application of H2O2 (100 μM) and the changes in stimulation frequencies (1 and 3 Hz). B: bar graph showing changes in the diastolic Ca2+ and Ca2+ transient in response to the application of H2O2 and changes in stimulation frequencies (n = 10). F/F0, ratio of fluorescence intensity to the resting fluorescence intensity.

