
Figure 1.
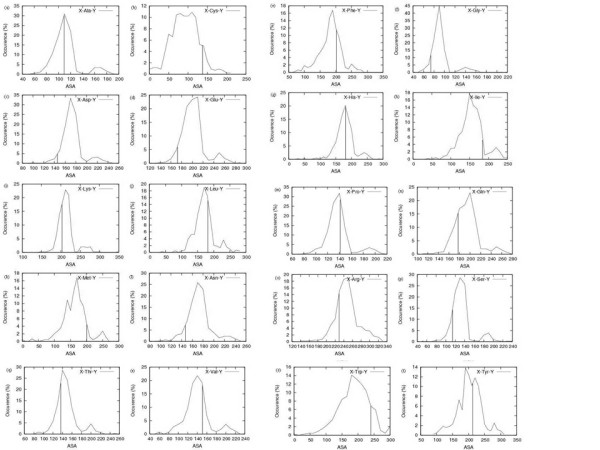
Histogram of highest observed ASA (HOA) of X-Z-Y tripeptides for residue Z where X and Y are the flanking amino acid residues in actual structures. The Vertical line indicates (currently used) extended state ASA (ESA) of Ala-X-Ala. Subplots are arranged alphabetically by one-letter code (Ala to Tyr). X-axis shows the HOA and Y-axis shows the number of tripeptides (out of 400 possible combinations), whose HOA falls in that range.