
Figure 6.
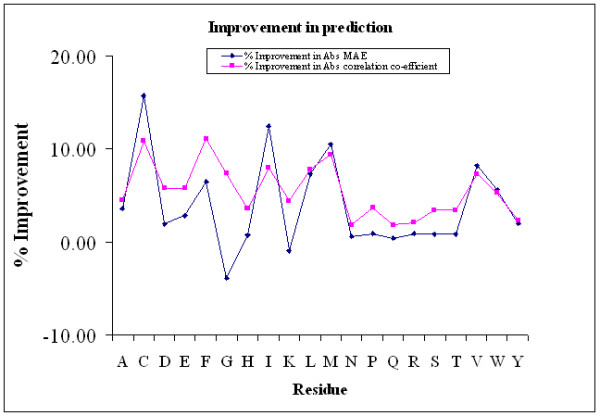
Improvement in the prediction of ASA using HOA- and ESA- normalized data sers. Both MAE and correlation co-efficient between absolute ASA values are shown and improvement is defined relative to the MAE in the ESA-normalized predictions.
Official websites use .gov
A
.gov website belongs to an official
government organization in the United States.
Secure .gov websites use HTTPS
A lock (
) or https:// means you've safely
connected to the .gov website. Share sensitive
information only on official, secure websites.
Improvement in the prediction of ASA using HOA- and ESA- normalized data sers. Both MAE and correlation co-efficient between absolute ASA values are shown and improvement is defined relative to the MAE in the ESA-normalized predictions.