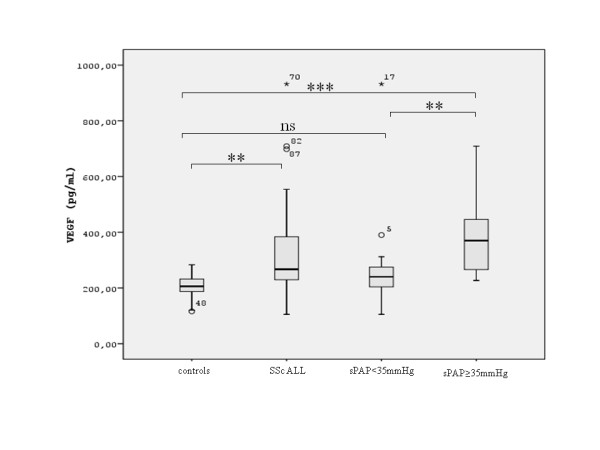
Figure 2.

Serum VEGF levels in patients with SSc and in healthy controls. Data are shown as box plots, with upper and lower quartiles shaded. All: all patients with SSc, sPAP < 35 mmHg: patients with sPAP < 35 mmHg, sPAP ≥ 35 mmHg: patients with sPAP ≥ 35 mmHg. **:p < 0.01, ***:p < 0.001, ns: non significant.
