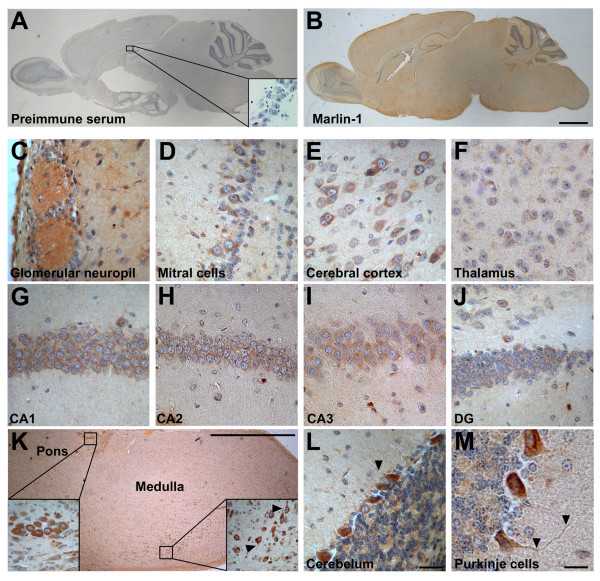
Figure 1.
Cellular distribution of Marlin-1 in the brain. (A) Sagittal section of a mouse brain showing immunoperoxidase staining with pre-immune serum. Inset shows a high magnification image of the hippocampus. (B) Same as above with Marlin-1 antibodies. (C-M) High magnification images of regions of interest: (C) glomerular neuropil of olfactory bulb; (D) mitral cells of olfactory bulb; (E) layer IV of cerebral cortex; (F) thalamus; (G) CA1 of hippocampus; (H) CA2 of hippocampus; (I) CA3 of hippocampus; (J) dentate gyrus; (K) brainstem; insets show higher magnification of indicated areas; (L) Purkinje cells of the cerebellum; (M) higher magnification of Purkinje neurons of the cerebellum. Scale bar in B, 100 μm (same for A and B); scale bar in L, 20 μm (same for C-J and L); scale bar in K, 100 μm; scale bar in M, 10 μm.

