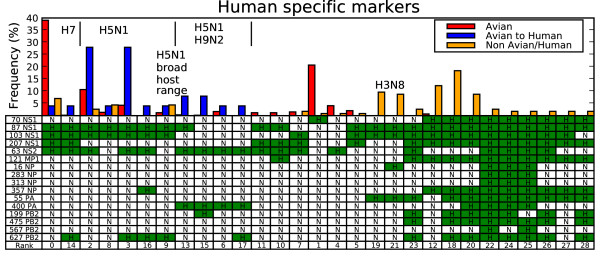
Figure 1.
Persistent human markers in non-human strains. Each column in the table is a genotype with the bars showing genotype frequency for avian (red), avian to human crossovers (blue) and non-avian non-human strains (orange). A table entry with H (green) means the amino acid position has the human consensus for the amino acid position, and N means non-human consensus. The last row "Rank" labels each genotype and shows its frequency rank among avian strains. Rank is in increasing order with 0 being the most common genotype. Select strain subtypes are shown in the figure, with details given in the text.

