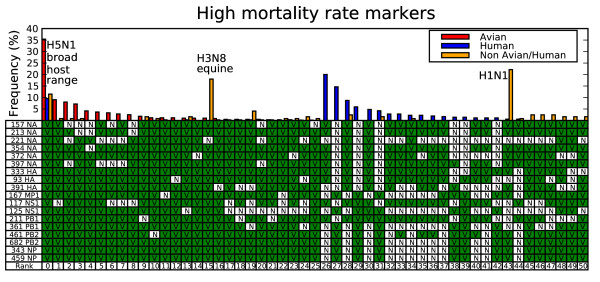
Figure 2.
High mortality rate genotypes. Each genotype is specified by a column in the table, where the bars above the column reflect relative frequency in the sequenced genomes. V (green) means the genotype has the virulent consensus for the position, and N means non-virulent consensus. Bars above each table column mark the relative frequency for avian (red), human – both high mortality rate and low mortality rate cases (blue) and non-avian non-human strains (orange bars).

