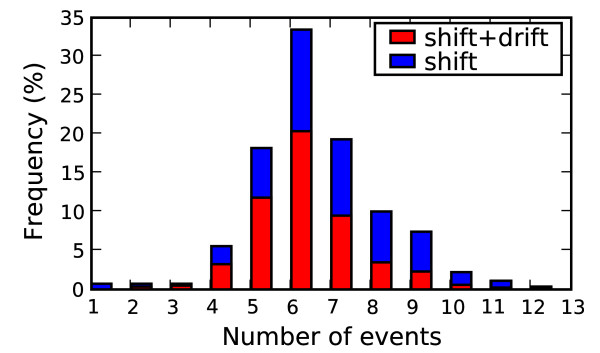
Figure 3.
Strain combinations with 34 markers. Frequency distribution for the number evolutionary events needed to acquire the 34 pandemic markers. The 9 pairwise combinations are shown for human, avian and non-human non-avian. Red bar overlays show the average contribution of reassortment events (shift) to the total event count with mutations (drift).

