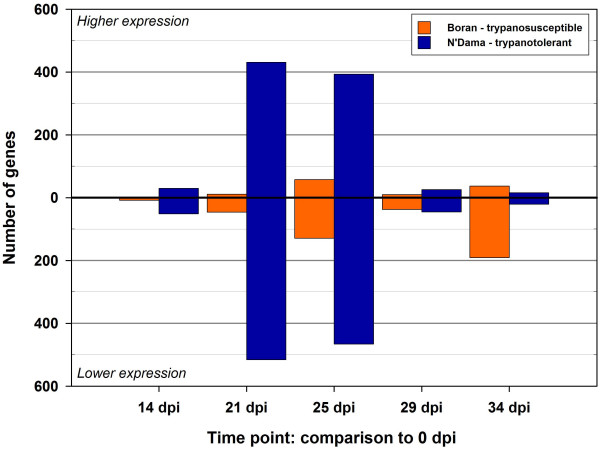
Figure 2.
Differentially expressed genes on the BLO microarray across the trypanosome infection time course. Gene expression contrasts across the time course for each time point relative to 0 dpi are shown for the trypanosusceptible (Boran) and trypanotolerant (N'Dama) breeds after adjustment for multiple testing using the false discovery rate correction of Benjamini and Hochberg [52].

