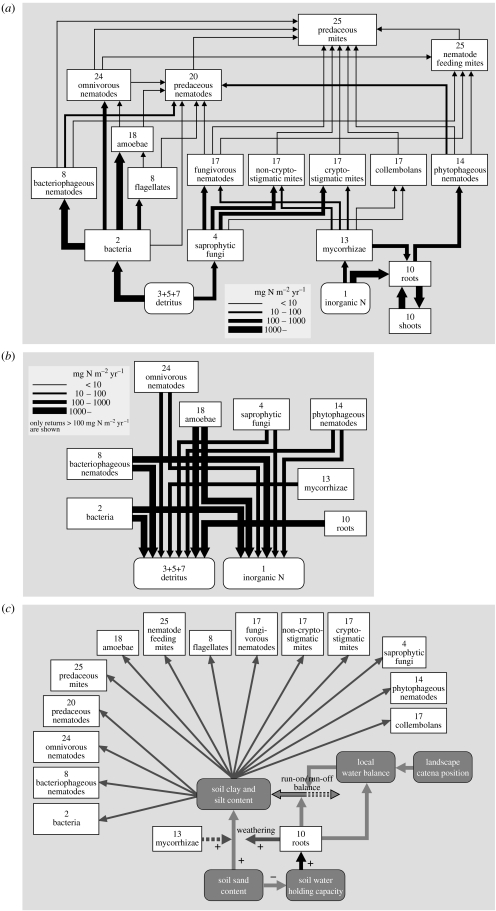
Figure 5.
The general framework for studying ecological networks (figures 1 and 2), as applied to the soil subweb of the short-grass plains ecosystem of Colorado, USA (Central Plains Experimental Range). (a) The interaction web based on consumer–resource interactions (food web), where the interaction topology and weights (presented here as nitrogen flow, in mgN m2 yr−1) is based on measured and calculated fluxes as presented by Hunt et al. (1987). (b) The detritus-production part of the consumer–resource interaction web (in mgN m2 yr−1), based on measured and calculated fluxes as presented by Hunt et al. (1987). Only returns greater than 100 mg N m2 yr−1 are shown. (c) The interaction web for the same ecosystem based on species effects on abiotic conditions and species responses to abiotic conditions, as inferred from information provided for this ecosystem by Hook & Burke (2000), and general information for other drylands (van Breemen 1993; Austin et al. 2004). The key process here is the modification of soil texture by plants and fungi (through effects on weathering and run-on/run-off balance, and the high sensitivity of soil biota to texture. Interaction weights were not available for the interaction web shown in (c). Numbers inside each box indicate the trophic functional group (figure 2). See figure 1 for the interpretation of the different types of arrow.

