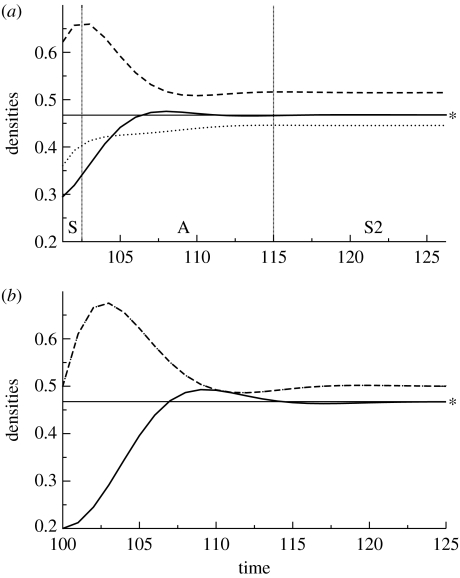
Figure 5.
The densities of a consumer (solid lines) and two resources (R1 (dashed lines) and R2 (dotted lines)) plotted after a perturbation at time 100. The horizontal line indicates the new equilibrium consumer density (asterisk). (a) Asymmetric energy flux through two resources results in weak–strong interaction pathways (parameters: r=1.0; K=1.0; a1=2.50; a2=1.50; α12=0.10; α21=1.1; e=1.0; m=0.50; and ω=0.5). Post-perturbation dynamics starts with resources characterized by synchronous dynamics (region S) followed by asynchronous dynamics (region A) and then back to synchronous but stable dynamics (S2). (b) Symmetric flux through two resources results in the two resources being synchronized throughout the post-perturbation period (r=1.0; K=1.0; a1=2.0; a2=2.0; α12=0.60; α21=0.6; e=1.0; m=0.50; and ω=0.5). Note that the greatest stability (quickest return time) occurs with (a) the asynchrony case as indicated by the consumer density approaching equilibrium faster. Note also that in (b) the completely synchronous case, the consumer, C, overshoots the new equilibrium (asterisk) to a greater extent than in (a) the asynchronous case.

