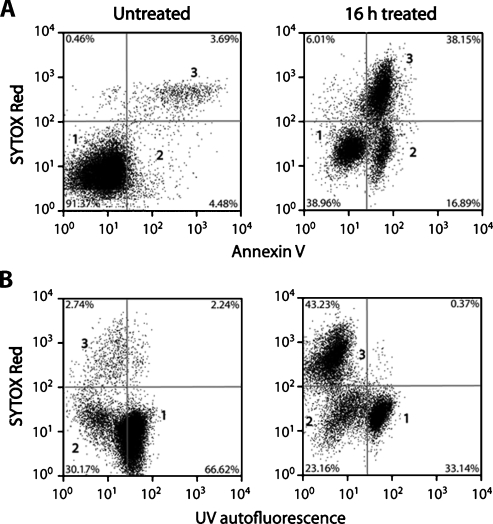
Figure 1.
Flow cytometric analysis of EL-4 cells treated for 16 hours with etoposide. (A) Detection of apoptotic cells using annexin V—Pacific Blue (λ Ex/Em = 410/455) and necrotic cells by SYTOX Red nuclear staining (λ Ex/Em = 640/658). (B) Changes in cellular autofluorescence after treatment. The autofluorescence observed at 455 nm with excitation at 350 nm has been assigned to NADH [25,26]. Population 1 represents viable cells, whereas population 2 represents apoptotic cells that have a low UV autofluorescence and stain with annexin V. Population 3 represents necrotic cells.

