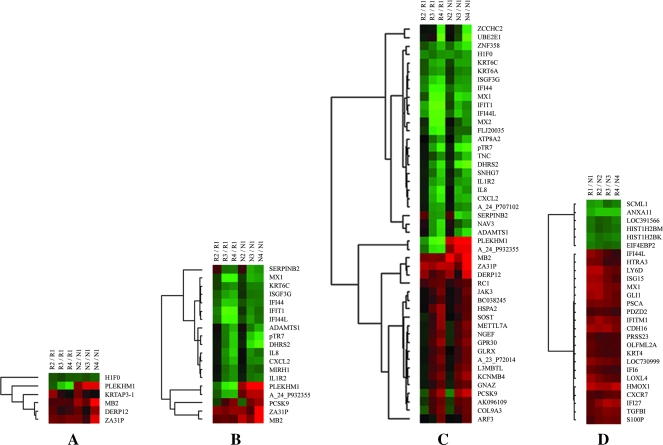
Figure 3.
Dynamic response of gene expression to cisplatin treatment and annexin A11-associated gene expression alterations. (A–C) Hierarchical clustering of gene expression alterations. Hierarchical clustering of genes either upregulated or downregulated more than two-fold change at 8 (A), 16 (B), and 24 hours (C) compared with 0 hour in both RNAi (R groups) and control (N groups) cell lines are shown. (D) Hierarchical clustering of genes with a fold up-regulation or down-regulation of at least two (R vs N) at every single time point are also shown. R1–R4 or N1–N4 represents different time points at 0, 8, 16, or 24 hours in order, respectively, in R or N groups. Clustering was performed using the Cluster and TreeView software. Genes that were increased are shown in red, whereas genes that were decreased are indicated in blue.

