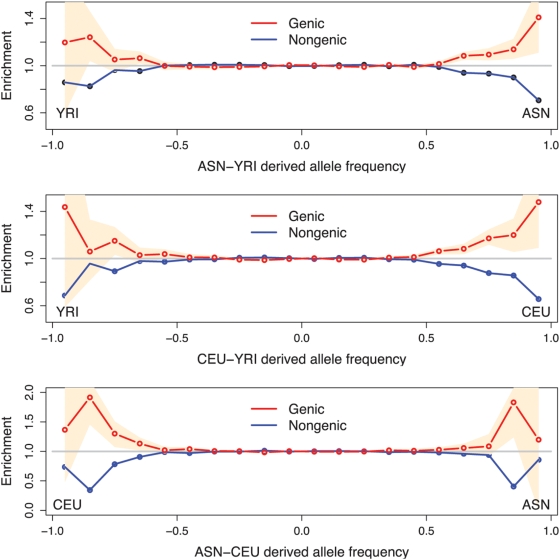
Figure 1. Genic SNPs are more likely than nongenic SNPs to have extreme allele frequency differences between populations.
For each plot the x-axis shows the signed difference  in derived allele frequency between two HapMap populations. The y-axis plots the fold enrichment of genic and nongenic SNPs as a function of
  : i.e., for each bin we plot the fraction of SNPs in that bin that are genic (respectively, nongenic), divided by the fraction of all SNPs that are genic (respectively, nongenic). The peach-colored region gives the central 90% confidence interval (estimated by bootstrap resampling of 200 kb regions from the genome); when the lower edge of the peach region is >1 this indicates significant enrichment of genic SNPs, assuming a one-tailed test at p = 0.05. Genotype frequencies were estimated from Phase II HapMap data using only SNPs that were identified by Perlegen in a uniform multiethnic panel (“Type A” SNPs) [46]. The numbers of SNPs in the tails are given in Supplementary Table 1 in Text S1.

