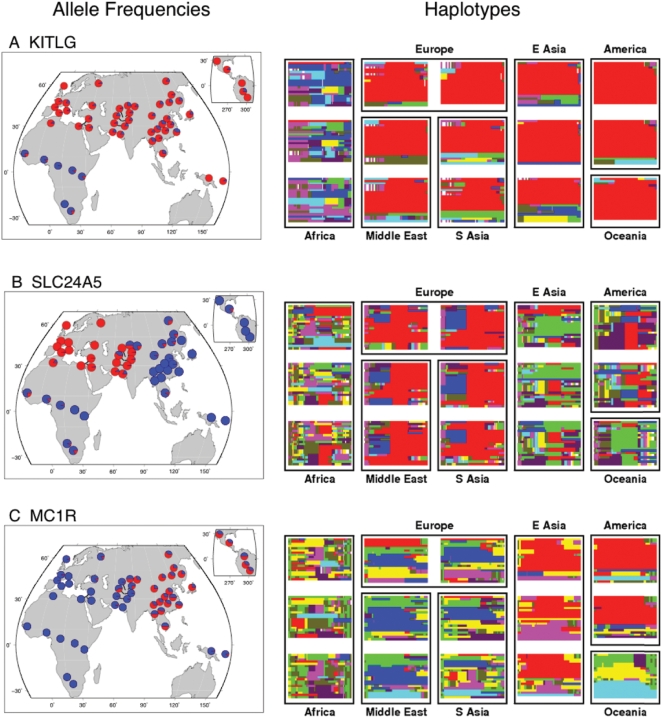
Figure 4. Global allele frequencies and haplotype patterns at three genes with signals of positive selection.
The left-hand column shows pie charts of allele frequencies (blue ancestral, red derived) across the HGDP populations for: (A) a SNP upstream of KITLG (rs1881227); and for nonsynonymous SNPs in (B) SLC24A5 (rs1426654; data from [18]), and (C) MC1R (rs885479). The right-hand column shows a representation of haplotype patterns for 500 kb around each gene, in each case centered on the SNP displayed in the pie charts. Each box represents a single population, and observed haplotypes are plotted as thin horizontal lines, using the same haplotype coloring for all populations (see Methods and [59]). In all three cases the derived allele plotted in the pie charts is found mainly on the red haplotype.

