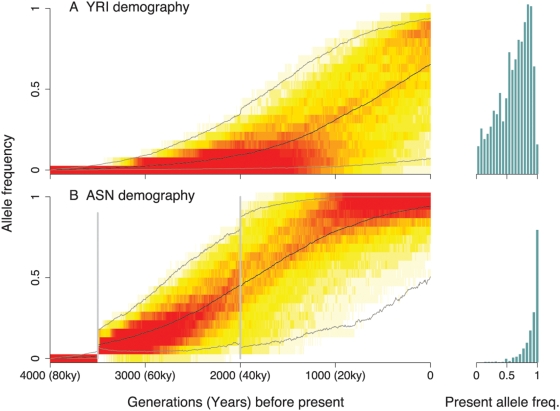
Figure 8. Population bottlenecks can simultaneously increase both the rate of loss and the rate of fixation of favored alleles.
Trajectories of favored variants were simulated according to demographic models for the (A) Yoruba, and (B) East Asian populations [7]. In each simulation the selected variant was introduced 4000 generations before the present (∼80 KYA), i.e., prior to the out-of-Africa event. The plots show heat maps of the distributions of frequencies at each time, conditional on the allele not being lost by the present day (time = 0). The timing of bottleneck events in the model are indicated by vertical grey bars in the ASN population. Redder shades indicate a higher density of selected mutations in a particular frequency bin. The black lines indicate the mean frequencies and the grey lines bracket the central 95% of the frequency distributions. The histograms on the right show the frequency spectrum of favored mutations in the present day, for each population, excluding mutations at frequency 0. The area of each histogram is proportional to the fraction of selected alleles that have frequency >0 in the present. Notice from the histograms that a much larger fraction of favored alleles survive to the present under the YRI demography, even though the fraction of alleles that are near fixation is much smaller in the YRI.

