
Figure 3.
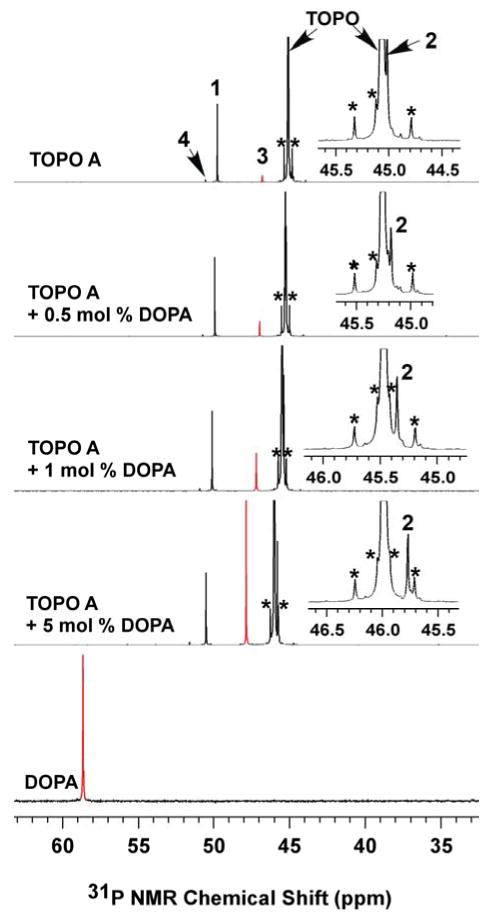
31P{1H} NMR spectra for identifying DOPA in TOPO A (00529CD). The spectra were collected in d6-acetone. The peak intensities for TOPO were normalized and the DOPA peaks labeled in red. Note the DOPA resonance in the mixtures shifted upfield from its pure form, whereas the resonance of TOPO and other impurities shifted downfield with increasing DOPA concentration. Insets: magnified view of the TOPO peaks to show the shifting of impurity 2. The 13C satellites (*) are labeled.