Figure 3.
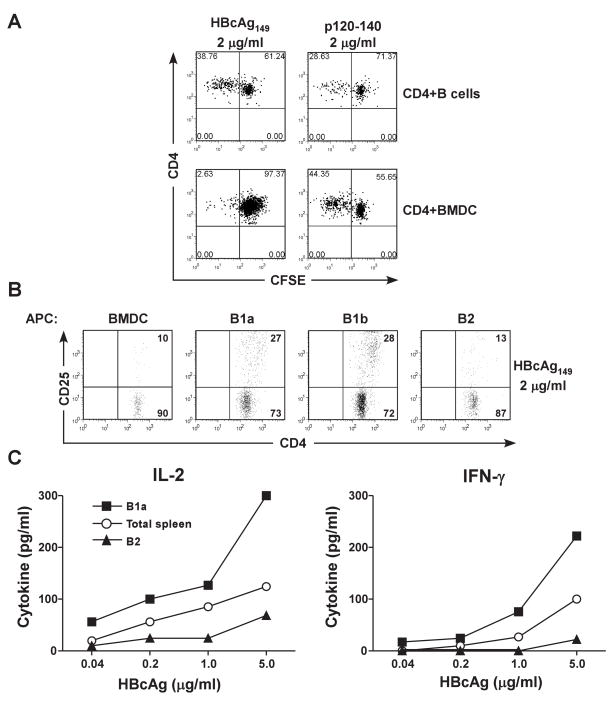
Preferential antigen presentation of HBcAg by B1a and B1b cells. (A). Fractionated, splenic B cells (4 × 10⁵) or BMDC (4 × 10⁵) were co-cultured with unprimed, CFSE-labeled 7/16-5 TCR-Tg CD4+ T cells (1 × 10⁵) in the presence of 2 μg/ml of HBcAg149 or p120–140 peptide. After 4 days, dilution of CFSE as a measure of CD4+ T cell proliferation was determined by FACS analysis. (B). The indicated fractionated cell populations (4 x 10⁵) (BMDC, splenic B1a, splenic B1b and splenic B2 cells) derived from unprimed B10 mice were cultured with HBcAg149 (2.0 μg/ml) and CD4+ T cells (1 × 10⁵) derived from 7/16-5 TCR-Tg mice. After 4 days of in vitro culture, CD4+ T cell activation was measured by CD25 expression determined by FACS analysis. (C). Unprimed, B10, total spleen cells, fractionated splenic B2 cells or fractionated, splenic B1a cells (4 × 10⁵) were co-cultured with unprimed, 7/16-5 TCR-Tg CD4+ T cells (1 × 10⁵) and HBcAg149 (.04–5.0 μg/ml) and CD4+ T cell activation was measured by IL-2 (day 2) and IFNγ (day 4) production as determined by ELISA. The results are representative of experiments performed on 2 separate occasions.

