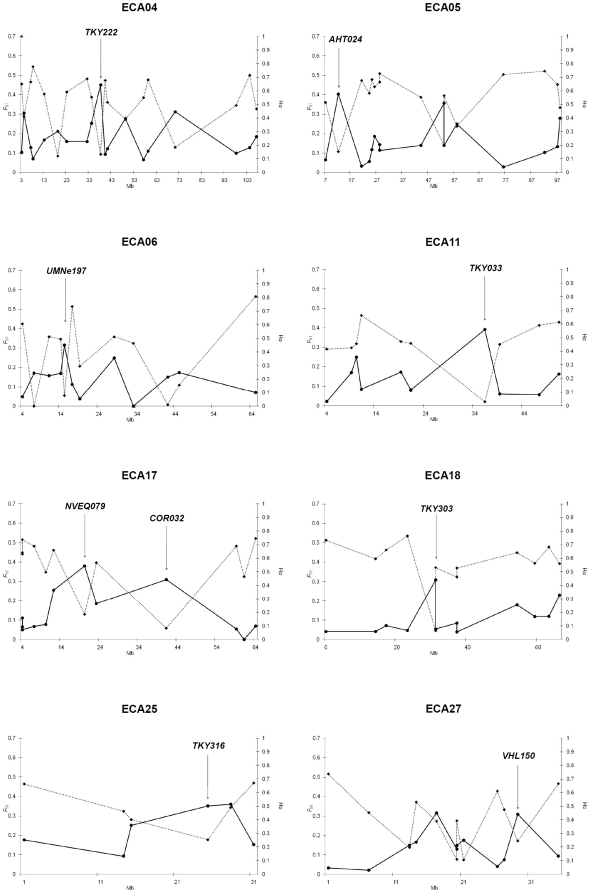
Figure 3. Chromosome-wide F ST versus Thoroughbred heterozygosity.
F ST (solid line) versus Thoroughbred heterozygosity (dashed line) plots across chromosomes for the nine highest F ST regions with significant (P<0.05) deviations from expected heterozygosity (Dh/sd) in Thoroughbred. Loci defining selected genomic regions are highlighted. Left vertical axis: F ST; Right vertical axis: Thoroughbred heterozygosity; Horizontal axis: chromosome position (Mb).

