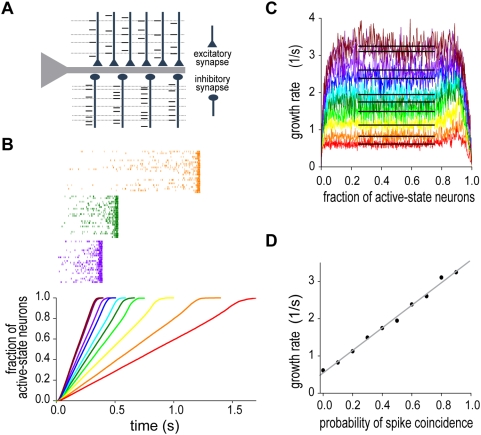
Figure 1. The behavior of the network model integrating the partially correlated synaptic inputs.
Our network model represents the moment-to-moment result of perfect temporal integration with the instantaneous number of active-state neurons. (A) Schematic drawing of the partially synchronized synaptic inputs. Both excitatory and inhibitory synapses receive partially coincident spikes (dashed lines). (B) Linear growth of the number of active-state neurons is shown with some examples of spike raster for various values of the probability of spike coincidence. Different colors represent different values of the coincidence probability. The network model was examined by Monte Carlo simulations with explicit treatment of the synaptic gate equation. (C) The growth rate was plotted as a function of the fraction of active-state neurons in the network. In accordance with the linear growth of neuronal activation, the rate stays around a constant value (horizontal black lines) for wide range of the fraction. (D) The rate is a linear function of the probability of spike coincidence. The grey straight line is obtained by the least square method.

