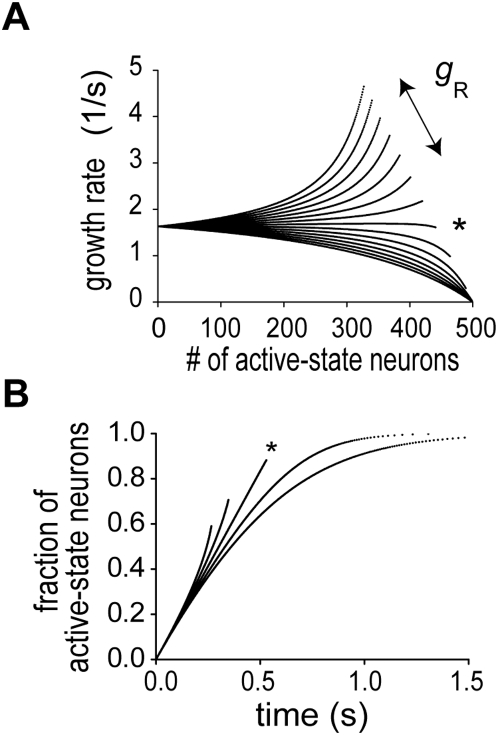
Figure 3. Effect of recurrent excitation on temporal integration of the network model.
(A) The growth rate of the number of neurons in the active states is plotted for various values of the maximum conductance of recurrent synapses. The upper the curve is, the larger the conductance is. At an adequate value of the maximum conductance (marked by asterisk), the rate is remarkably constant for a wide range of the number of active-state neurons. (B) Time evolution of active-state neurons is shown for three cases where the maximum synaptic conductance is greater than (upper two), equal to (asterisk) or smaller than (lower two) the adequate value.

