
Fig. 5.
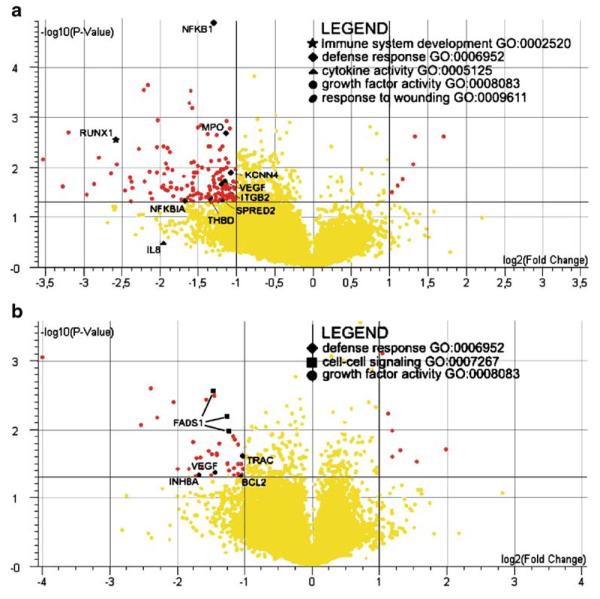
APECED patient moDCs show differential expression of genes compared to control moDCs. Volcano plots from Affymetrix arrays of a nonstimulated and b C. albicans-stimulated patient derived DCs vs. controls. Log2-transformed fold changes of gene expression are plotted as a function of the log of the p-values from the statistical test for differential expression (p-value cut-off 0.05. fold change cut-off two times). Genes belonging to Gene Ontology categories (e.g., GO:0002520) differentially expressed in the pathway analysis (see Fig. 6) are highlighted with different symbols as described in the legend table