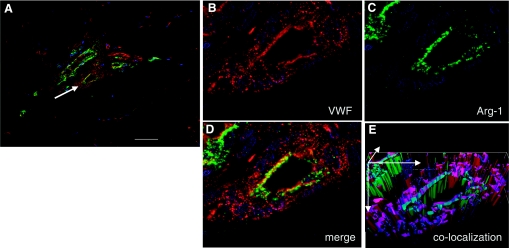
Fig. 12.
Localization of arginase-1 in wound vessels. Wound-edge tissues were collected on day 7 after wounding. OCT-embedded frozen biopsy tissues were sectioned (10 μm) and immunostained simultaneously with antibodies against arginase 1 (anti-arg-1, green) and von Willebrand factor (vWF; endothelial cells, red). A: representative immunostained section of a wound showing blood vessels (red) and Arg-1 staining (green). The scale bar = 50 μm. B: a zoomed image of VWF-stained (red) blood vessel as shown in A with white arrow. C: expression of Arg-1 (green). D: merged (vWF and Arg-1) image showing colocalization of Arg-1 in VWF-positive areas. E: to have a better visualization of the colocalization, the section was also imaged in the Z-plane (1 μm increments). The Z-images were stacked, and the merged red and green channels were visualized in 3 dimensions using Axiovision Inside4D module (Zeiss).

