Fig. 2.
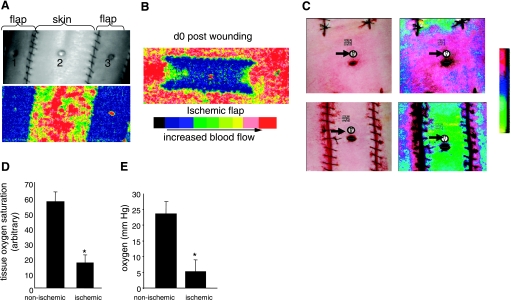
Characterization of wound-site ischemia and hypoxia. A: photographic (top) and Doppler (bottom) images of the back of swine with ischemic flaps and skin with intact perfusion. Nonischemic (2) and ischemic wound (1, 3) locations are marked; B: laser Doppler image of an ischemic flap on day 0 postwounding. C: wound tissue oxygen saturation and oximetry performed using a hyperspectral scanner (C, D) or OxyLite (E). C: representative photographic (left) and corresponding hyperspectral images (right) from nonischemic (top) and ischemic (bottom) wounds captured using a OxyVu2 hyperscpectral imaging system. The white circle and black arrows represent the hyperspectral target used for imaging. D: quantification of tissue oxygen saturation values from nonischemic and ischemic wounds as shown in C. Data are means ± SD (n = 4); *P < 0.01. E: wound-bed tissue Po2 was measured using OxyLite based on fluorescence quenching principle. d, Day. Data are means ± SD (n = 4), *P < 0.05.

