FIGURE 2.
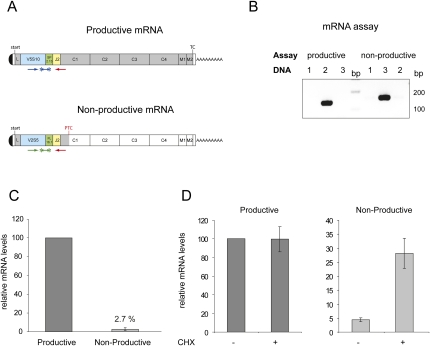
Releative mRNA levels of productively and nonproductively rearranged Ig-μ alleles. (A) Schematic illustration of productively and nonproductively rearranged Ig-μ mRNAs. Location of primers and TaqMan probes for the allele-specific TaqMan assays are shown below the mRNA. 5′ and 3′ UTRs are depicted as white boxes, VH segments are blue, D segments green, JH2 segments yellow, and the remaining parts of the ORFs are shown in gray. In the nonproductively rearranged mRNA, the ORF is truncated by a PTC at amino acid position 178. (B) For analysis of allele specificity of TaqMan assays, both assays were measured by qPCR with plasmids containing the sequence of the productively (DNA, lane 2) or the nonproductively rearranged allele (DNA, lane 3). qPCR products were resolved on an 2% agarose gel. Mouse cDNA from liver (DNA, lane 1) was used as negative control. (C) Relative mRNA abundances of the two Ig-μ alleles were measured by RT-qPCR using the allele-specific TaqMan assays. Values and standard deviations of three independent experiments with two runs each were calculated using the previously determined amplification rates. (D) Effect of cycloheximide (CHX) treatment on relative abundances of productive (left) and nonproductive Ig-μ mRNAs (right). Cells were incubated for four hours with 50 μg/mL CHX and relative mRNA levels were determined by RT-qPCR. Values and standard deviations of one representative experiment were calculated as in C.

