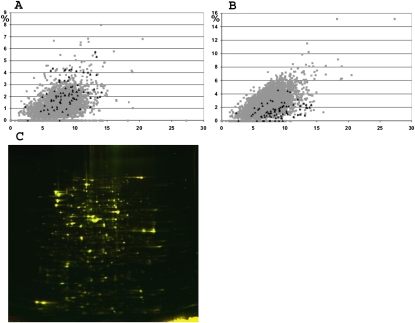
FIGURE 5.
Highly expressed gene codon bias for tRNA1Val GUA (A) and GUG (B) codons. Plotted is the particular codon frequency (in percent relative to total codons) against total number of valine codons (in percent relative to total codons). Gray boxes correspond to each of E. coli genes. Black triangles correspond to highly expressed genes (Karlin et al. 1998, 2001). (C) Two-dimensional protein gel, showing a comparison of protein composition of wild-type strain (labeled red) and ΔyfiC strain (labeled green). Yellow color corresponds to equal amount of protein in both strains.

