Figure 2.
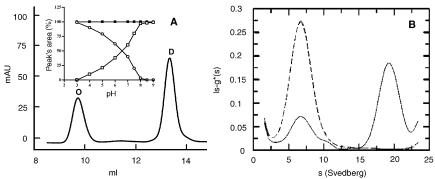
Effect of pH on the oligomeric state. (A) Gel permeation chromatography: 30 µg of protein was incubated overnight in 50 mM BIS-TRIS propane buffer at pH 7.2, then injected onto the Superdex 200 column, eluted at room temperature at 0.4 ml min–1 with 20 mM phosphate buffer containing 150 mM NaCl and monitored at 226 nm. Abbeviations: O = octamer; D = dimer. The inset shows the percentage of each peak’s area from the elution patterns of wild type (wt) protein samples obtained after overnight incubation with buffers at various pH values (open circles = octamer; open squares = dimer). The filled squares show the percentage of the dimer’s area obtained with Y41C mutant samples after overnight incubation with buffers at various pH values. (B) Analytical ultracentrifugation:the wt protein concentration was 0.5 mg ml–1 in 50 mM phosphate buffer at pH 6.0 (solid line) and 8.0 (dashed line). Experiments were conducted at 1.17 × 10⁵ g and 20 °C, at a wavelength of 278 nm after reaching equilibrium (12 h). Peak (80%) with Sw,20 = 18 corresponds to the octamer (about 400 kDa). Peak (20%) with Sw,20 = 6 corresponds to the dimer (about 100 kDa).

