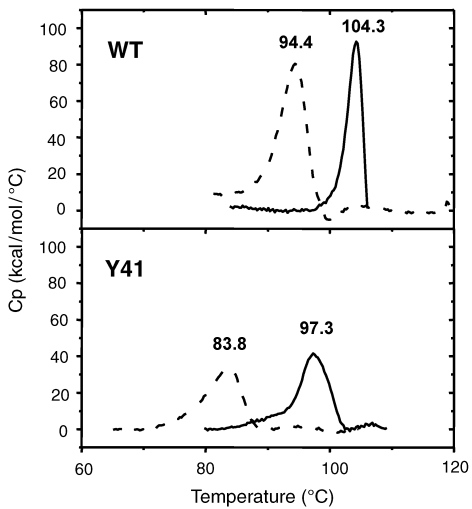
Figure 5.
Differential scanning calorimetry thermograms of wild type (wt) amidase and its Y41C mutant at different pH values. Solid lines correspond to traces obtained in 20 mM citrate buffer at pH 4.0, dotted lines to those obtained in 20 mM sodium phosphate at pH 8.0. The concentration was always expressed as moles of dimer. Denaturation temperatures (Tm) are indicated above the corresponding peak.

