Figure 5.
Atg26-Dependent Pexophagy and Fungal Pathogenesis.
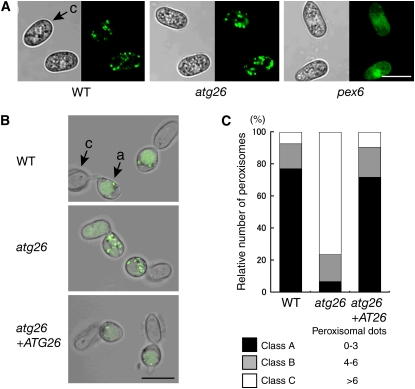
(A) Peroxisome assembly in the atg26 mutant. GFP-SKL was expressed in tested strains, and the GFP fluorescence was observed in the conidia. Bar = 10 μm. c, conidium.
(B) The atg26 mutant exhibits a defect in pexophagy. Conidia from the tested strains expressing GFP-SKL were incubated on glass for 24 h. Bar = 10 μm. a, appressorium; c, conidium.
(C) Quantitative analysis of pexophagy in appressoria. Conidia from the tested strains expressing GFP-SKL were incubated on glass for 24 h. For each experiment, punctate dots of GFP fluorescence representing peroxisomes were counted in the appressoria (n = 100) and the values were divided into three classes (class A, zero to three punctate dots; class B, four to six punctate dots; class C, more than six punctate dots). The percentage of each class in the tested strains was calculated. Data represent the means from three independent experiments that gave similar results.
[See online article for color version of this figure.]

