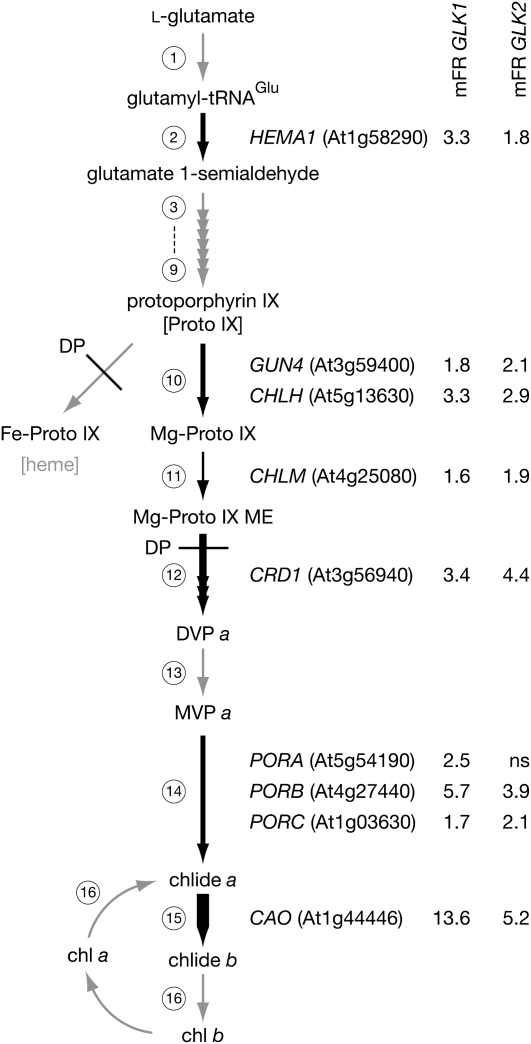
Figure 4.
Effect of GLK1 and GLK2 Induction on the Chlorophyll Biosynthetic Pathway.
Schematic of the chlorophyll biosynthetic pathway with steps with significant changes in gene transcript levels following GLK induction depicted with black arrows; the relative strength of induction is reflected in the thickness of the arrow. Nonsignificantly changed steps and pathways are depicted with gray arrows. Values represent the mean fold ratio (mFR) change in gene expression (induced relative to noninduced) following induction of GLK1 and GLK2. For clarity, only genes with significantly changed transcript levels are shown for each step. Significance threshold of P ≤ 0.05, n ≥ 3 biological replicates. ns, not significant. Circled numbers refer to enzymatic steps listed in Supplemental Table 6 online, which details the changes in all genes involved in this pathway. Steps inhibited by DP are also shown. The genes are HEMA1; GUN4; CHLH; CHLM, Mg-protoporphyrin IX methyl transferase; CRD1, Mg-protoporphyrin IX monomethyl ester cyclase; PORA/PORB/PORC, protochlorophyllide oxidoreductase A/B/C; CAO; MgProtoME, magnesium protoporphyrin monomethyl ester; DVP, divinylprotochlorophyllide; and MVP, monovinylprotochlorophyllide.

