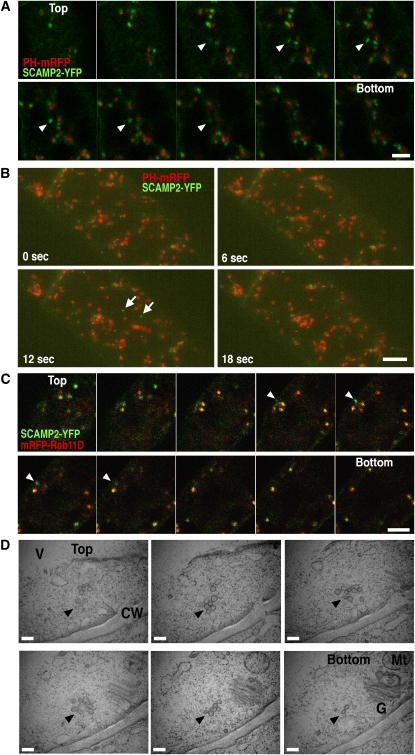
Figure 7.
SVCs Are Separated from the Golgi Apparatus.
(A) A z axis scanning series of fixed BY-2 cells expressing PH-mRFP and SCAMP2-YFP. Arrowheads indicate SVCs.
(B) The transparency projection of three-dimensional reconstructions of a BY-2 cell expressing PH-mRFP and SCAMP2-YFP using 4D-CLSM at four time points. The panels show time-lapse pictures; arrows show SVCs. Bar = 5 μm. Movement can be seen in Supplemental Movie 1 online. Bars = 5 μm in (A) and (B).
(C) A z axis scanning series of fixed BY-2 cells expressing mRFP-Rab11D and SCAMP2-YFP. Arrowheads indicate SVCs. Bar = 5 μm.
(D) Electron micrographs of 80-nm serial sections of SVCs in tobacco BY-2 cells. Arrowheads indicate SVCs. Bar = 200 nm.

