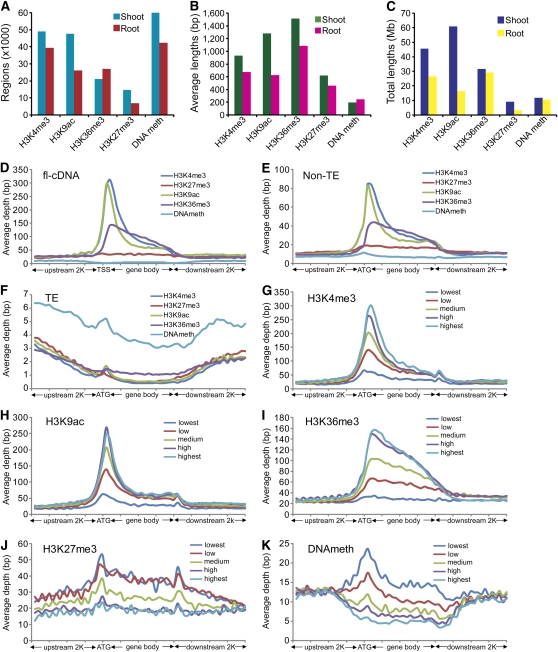
Figure 3.
Genome-Wide and Genic Distribution Patterns of Epigenetic Modifications.
(A) to (C) Numbers, average lengths, and total lengths of epigenetically modified regions detected by MACS software.
(D) to (F) Distribution of H3K4me3, H3K27me3, H3K9ac, H3K36me3, and DNA methylation levels within flcDNAs, predicted TE-related, and non-TE genes aligned from TSSs and ATG, respectively. The y axis shows the average depth, which is the frequency of piled-up reads at each base divided by the bin size. The x axis represents the aligned genes that were equally binned into 40 portions, including 2K up- and downstream regions.
(G) to (K) Distribution of H3K4me3, H3K27me3, H3K9ac, H3K36me3, and DNA methylation within five groups of genes with different expression levels summarized from validated non-TE genes.

