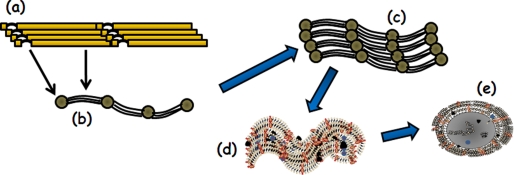
FIGURE 2.
Diagram highlighting the main steps in microfibril biogenesis. They include the polymerization of fibrillins in a head-to-tail organization (step a) that is visualized by electron microscopy as multiple strings with regularly spaced beads (step b). The beads correspond to the N-terminal regions of fibrillins containing the Gly/Pro-rich stretch (arch) and the sites interacting with TGFβ and BMP complexes, whereas the strings correspond to the central sequence of multiple cbEGF motifs interspersed with a few TB/8-Cys modules (see Fig. 1). Also shown are microfibrils (step c) growing into large macro-aggregates that are either devoid of elastin (step d) or associated with cross-linked elastin (gray core) in elastic fibers (step e). Orange, blue, and black circles depict microfibril- and elastin-interacting molecules; additionally, some microfibrils are shown buried within amorphous elastin. A detailed description of microfibril and elastic fiber biogenesis can be found in several recent reviews (2, 4, 5).

