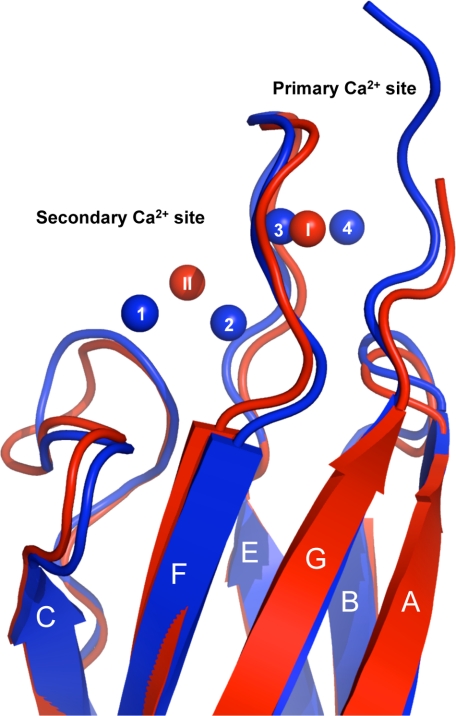
FIGURE 4.
Overlay of WT-CBD1 and CBD2 demonstrating the conserved Ca2+ binding sites. WT-CBD1 is shown as a blue drawing with Ca2+ ions depicted as blue spheres. CBD2 (PDB code: 2QVM) is represented as a red drawing with the primary (I) and secondary (II)Ca2+ ions depicted as red spheres (r.m.s.d. = 1.1 Å over 112 Cα). The CBD2 primary Ca2+ binding site is at a position homologous to Ca2+ ions 3 and 4 of CBD1. For clarity, the strands are labeled A–G.

