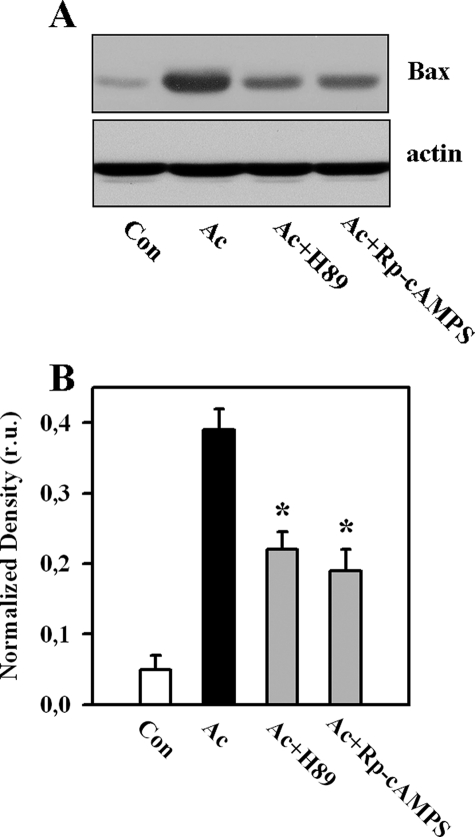
FIGURE 6.
Western blot analysis of Bax in mitochondrial fractions (A), followed by band optical density analysis (B), from control EC (Con) or EC exposed to acidosis without (Ac) or with treatment with inhibitors of PKA: 3 μmol/liter H-89 or 30 μmol/liter (Rp)-adenosine 3′,5′-cyclic monophosphorothioate (Rp-cAMPS). Western blot data are representative of four independent experiments with similar results. Values are means ± S.E. (n = 4). *, p < 0.05 versus acidosis. r.u., relative units.

