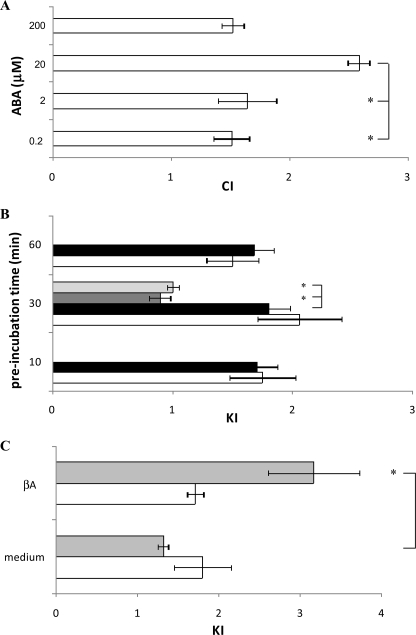
FIGURE 6.
ABA-induced chemotaxis and chemokinesis in N9 cells. Migration of N9 cells through 8-μm pore membranes was measured in ChemoTx chambers. A, cell migration toward a solution containing ABA at the concentrations indicated is expressed as CI. The results shown are the means ± S.D. from three different determinations (p < 0.001, compared with CI values toward medium). *, p < 0.01. B, N9 cells were incubated for the time indicated on the y axis with either 0.25 μm (white bars) or with 20 μm (black bars) ABA and then placed in the ChemoTx chamber to migrate toward medium for 90 min. The cells were preincubated with 8-Br-cADPR (100 μm for 90 min; gray bar) or with nicotinamide (10 mm for 5 min; light gray bar) before exposure to 20 μm ABA for 30 min. The results are expressed as KI and are the means ± S.D. from seven different experiments (p < 0.001, compared with KI values of untreated N9 cells). *, p < 0.001. C, N9 cells were preincubated for 30 min (white bars) or for 24 h (gray bars) with 20 μm ABA and then challenged to migrate toward medium or toward 15 μm βA. Untreated N9 migrated similarly toward medium and toward βA (KI = 1.1; not shown). The results are expressed as KI and are the means ± S.D. from four different experiments (*, p < 0.01).

