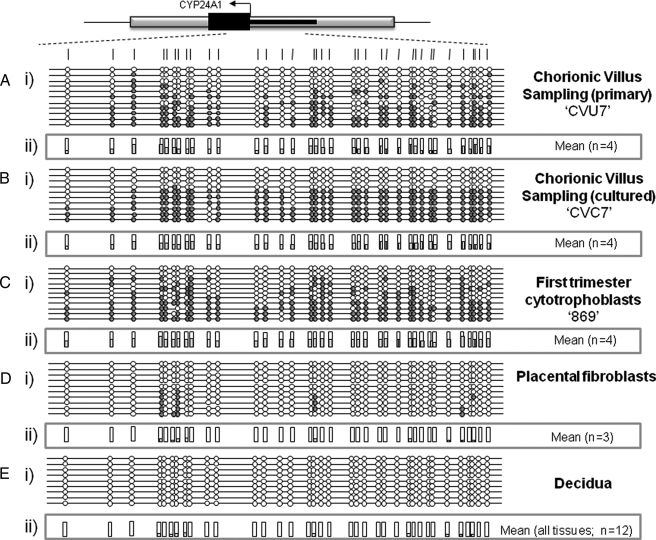
FIGURE 2.
Methylation of CYP24A1 in different human placental tissues and cell types. Representative methylation data generated for the CYP24A1-2 assay in cytokeratin-7 positive cytotrophoblasts (A), uncultured CVS (B), cultured CVS (C), full term placental fibroblasts (D), and whole blood (E). i, between 8 and 12 individual clones were sequenced for each sample. Circles, CpG sites denoted by vertical dashes. Closed circles, methylation; open circles, lack of methylation. Missing circles indicate CpG sites for which no information was obtained. Gray boxes, to GpG island locations; arrows, start site of translation within exon 1 (black line). ii, mean methylation levels seen at each CpG site for each type of sample tested. Numbers of each type of tissue are listed in parentheses.

