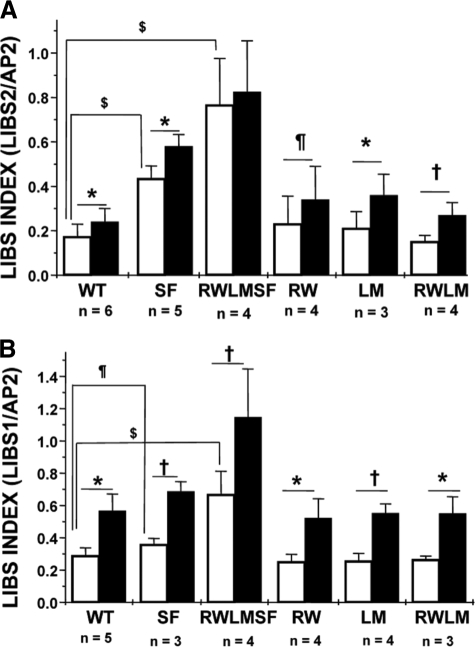
FIGURE 4.
Flow cytometry analysis of LIBS exposure on WT and mutant αIIbβ3 receptors expressed on CHO cells. Washed cells were incubated for 30 min at room temperature in the absence (white bars) or presence (black bars) of RGDS peptide. Next, anti-LIBS2 (A) or anti-LIBS1 (B) antibodies or AP2 (A and B) was added for 30 min at room temperature, and bound antibody was detected with FITC-labeled rabbit anti-mouse immunoglobulins. Anti-LIBS antibody binding is expressed as the LIBS index, which is the ratio of the mean fluorescence intensity for anti-LIBS antibody (in the presence or absence of RGDS) to the mean fluorescence intensity for AP2. The latter is used for normalization of the amount of receptors expressed on each cell line. Data are the means ± S.D. $, p < 0.001; *, p < 0.01; †, p < 0.05; ¶, p < 0.1. WT, CHO-αIIb/β3; SF, CHO-αIIb/β3(SF); RWLMSF, CHO-αIIb(RWLM)/β3(SF); RW, CHO-αIIb(RW)/β3; LM, CHO-αIIb(LM)/β3; RWLM, CHO-αIIb(RWLM)/β3.

