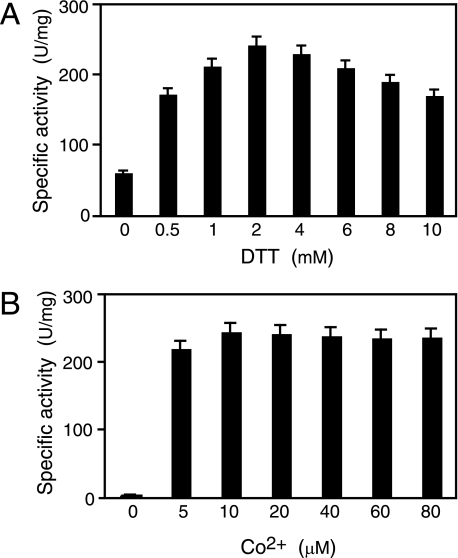
FIGURE 3.
Activation of apo-α2β2 by apo-αe2 under various conditions in vitro. A, effect of the DTT concentration on apo-α2β2 activation. Apo-α2β2 was mixed with apo-αe2 in the activation buffer containing 20 μm CoCl2 and 0, 0.5, 1, 2, 4, 6, 8 or 10 mm DTT. B, effect of the cobalt concentration on apo-α2β2 activation. Apo-α2β2 was mixed with apo-αe2 in the activation buffer containing 2 mm DTT and 0, 5, 10, 20, 40, 60, or 80 μm CoCl2. Aliquots of the samples were removed at 12 h and then assayed for L-NHase activity. Values represent the means ± S.D. for at least triplicate independent experiments.

