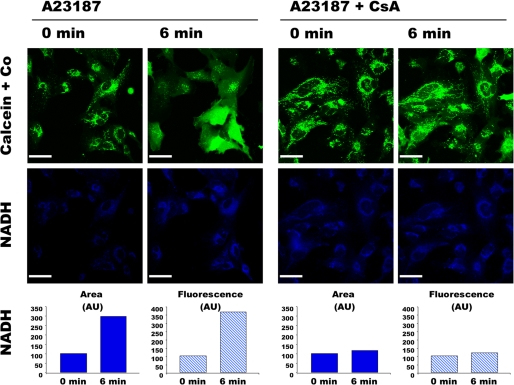
FIGURE 1.
Double channel imaging of PTP opening and NAD(P)H autofluorescence. HMEC-1 cells coloaded with 0.25 μm calcein-AM and 8 mm CoCl2 (Co) in the absence or presence of 1 μm CsA were exposed to 0.05 μm A23187. The fluorescence of calcein (green) and NAD(P)H (blue) was imaged simultaneously every 3 min. NAD(P)H quantification (arbitrary units (AU)) was calculated with the Volocity software using a threshold value of 50, which corresponded to the highest fluorescence outside cells. Area represents the sum of all the pixels above the threshold in the image shown. Fluorescence represents the whole fluorescence of the pixels with fluorescence intensity above the threshold in the presented image. Bar, 44 μm.

