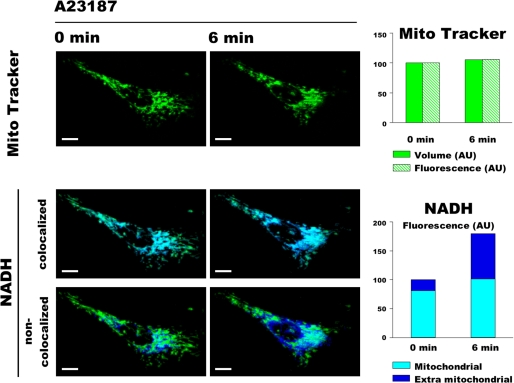
FIGURE 2.
Three-dimensional double channel imaging of NAD(P)H autofluorescence and mitochondrial volume. HMEC-1 cells loaded with 50 nm MitoTracker Green were exposed to 0.05 μm A23187. The fluorescence of NAD(P)H (blue) and MitoTracker (green) was imaged every 3 min in 11 optical sections with 0.3-μm z-step. NAD(P)H images were split in two images using ImageJ software, one that colocalizes with MitoTracker (i.e. mitochondrial NAD(P)H) and the other that does not colocalize with MitoTracker (i.e. extra mitochondrial NAD(P)H). The presented images represent three-dimensional reconstructions of the 11 optical sections performed with the Volocity software. Volume represents the sum of all the voxels above a threshold value of 3 for MitoTracker. Fluorescence represents the fluorescence intensity of all the voxels above a threshold value of 3 and 50 for MitoTracker and NAD(P)H, respectively. Bar, 10 μm.

