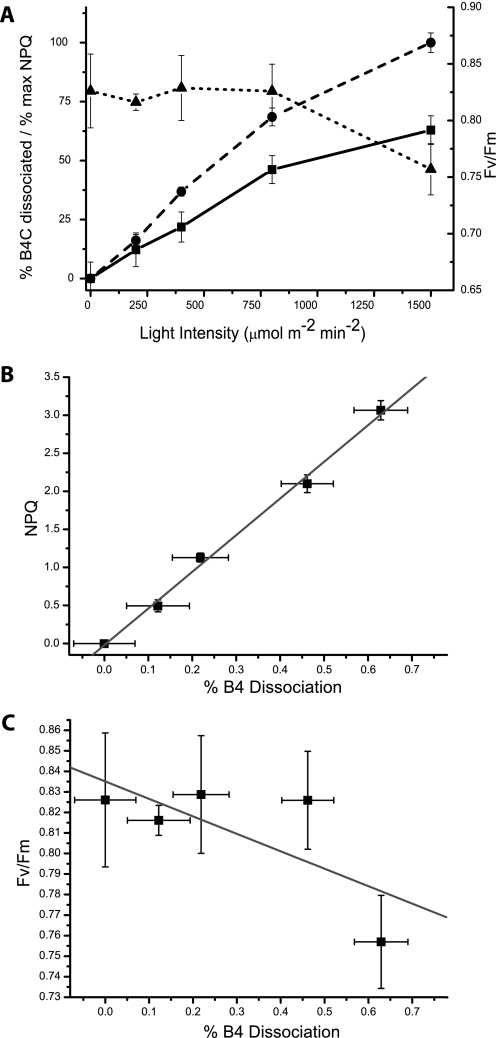
FIGURE 2.
A, comparison of B4C dissociation (solid line, squares), NPQ (dashed line, circles), and PSII yield (Fv/Fm, dotted line, triangles). All parameters were evaluated after 30 min of light treatment at the indicated intensity. B4C is quantified as the ratio of the band with respect to the sum of all bands containing antenna upon separation of pigment-binding complexes in sucrose gradient or nondenaturing gel. NPQ values, in order to have a scale comparable with B4C dissociation, are expressed as a fraction of the maximal value (3.1). Fv/Fm values where measured after 15 min of dark incubation following light treatment to allow for PSII reduction and NPQ relaxation but not recovery from photoinhibition. B, correlation between B4C dissociation and NPQ measured with different light intensities is analyzed in more detail. Line shows the linear fitting of reported points (R-value is 0.997). C, correlation analysis of Fv/Fm and B4C dissociation determined using different illumination intensities. Line shows the best linear fitting of reported points (R-value is 0.71).

