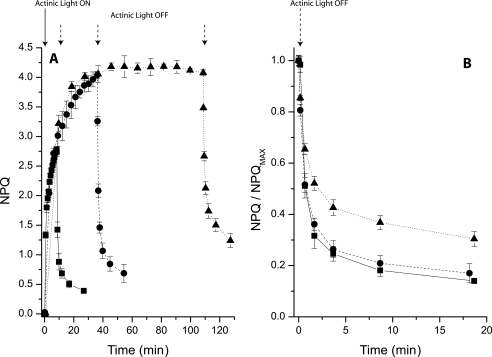
FIGURE 6.
Long term NPQ induction and recovery. A, NPQ kinetics in WT leaves was recorded using different durations of actinic light. For all samples NPQ was recorded at 12 points during illumination. Curves with 8, 36, and 108 min of actinic light are shown, respectively, as a solid line with squares, a dashed line with circles, and a dotted line with triangles. In all samples, six points were recorded at the same time intervals during dark recovery. B, enlargement of recovery kinetics shown in A after normalization to maximal NPQ.

