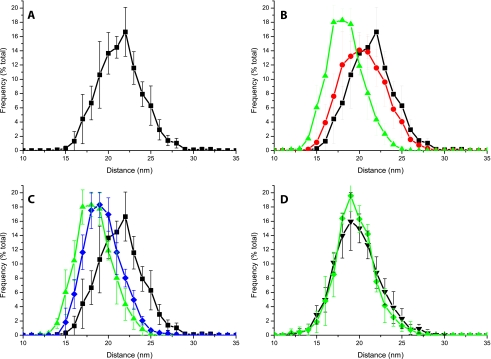
FIGURE 8.
Analysis of PSII distribution in grana isolated from dark/light-treated leaves. A, distribution of PSII complexes in grana membranes from dark-adapted leaves expressed as the average distance from the four nearest PSII core complexes. B, comparison of PSII distribution in dark-adapted samples (black squares) or those treated with 30 min (red circles) and 90 min (green triangles) of light before grana isolation. C, comparison of light-adapted samples (green triangles) with samples treated successively with 90 min of dark following light treatment (blue diamonds). D, effect of light treatment on PSII distribution in npq4 grana membranes. Dark-adapted sample is shown as black triangles and 90-min light-treated sample as green diamonds. S.D. in the case of the x axes is the maximum 1.5 nm.

