FIGURE 5.
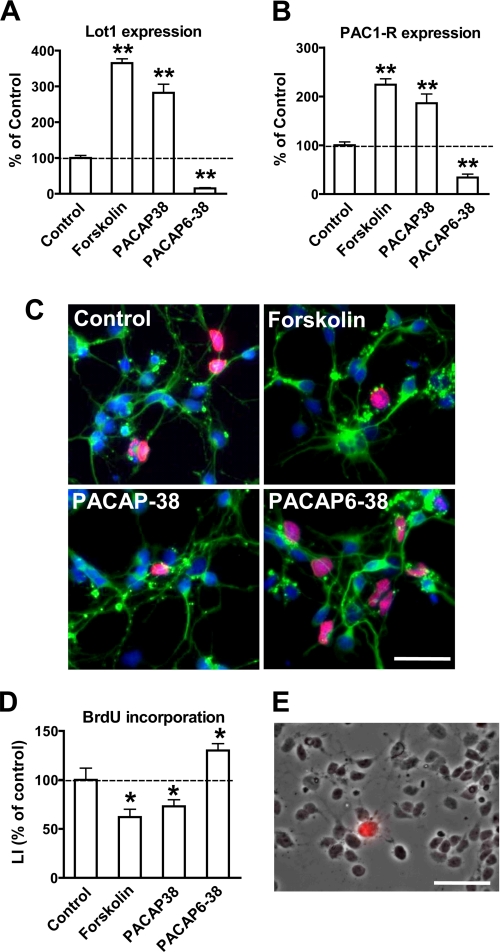
Effect of PACAP-38 and PACAP6-38 on proliferation of GCP in culture. A and B, Lot1 (A) and PAC1-R (B) mRNA expression were quantified by RT-qPCR in GCP cultures treated with forskolin (10 μm), PACAP-38 (10 nm), or PACAP6-38 (1 μm) for 20 h. Data, given as % of untreated conditions, are expressed as the mean ± S.E. of three independent experiments. C, double immunofluorescence for β-tubulin III and BrdUrd of GCP at 1 day in vitro. One hour after plating GCP cultures were stimulated with forskolin (10 μm), PACAP-38 (10 nm), or PACAP6-38 (1 μm) for 20 h. BrdUrd (10 μm) was added for the last 6 h, and thereafter cells were processed for double immunofluorescence with anti-BrdUrd (red) and anti-β-tubulin III (green) antibodies. Cell nuclei were stained by Hoechst dye (blue). Scale bar, 50 μm. D, LI, defined as percentage of BrdUrd-positive cells over total cell number, was determined for GCP treated as reported in C. Data are expressed as the means ± S.E. of three independent experiments. E, phase-contrast image of GCP after 1 day in culture, merged with an immunofluorescence image showing a Purkinje cell immunostained for anti-calbindin-28 kDa (red). Scale bar, 40 μm. The asterisks (B, D, and E) indicate a significant difference between the treated versus untreated condition; *, p < 0.05; **, p < 0.01; Bonferroni's test after ANOVA.

